Business at a Glance is a tool designed to keep you on top of your business. Are you doing more inspections than last year? What types of inspections are generating most of your revenue? How many inspections is each inspector doing?
Business at a Glance allows you to track your business success through colorful graphs and charts. It also lets you:
- Turn reports on or off
- Change the order in which reports appear
- Change the date range for reports (You may want some by month and some by year, for example.)
- Decide whether to include work-in-progress in your reports
- Export your reports to Excel to put into your accounting software, calculate inspectors’ pay or create other business reports.
In this session we will cover:
- Viewing Business at a Glance
- Adding, removing and changing the order of reports
- Changing the date range of reports
- Including or excluding Works in Progress
- Exporting chart data to Excel
Viewing Business at a Glance
1) Click on Business at a Glance from the Home page to open this section.
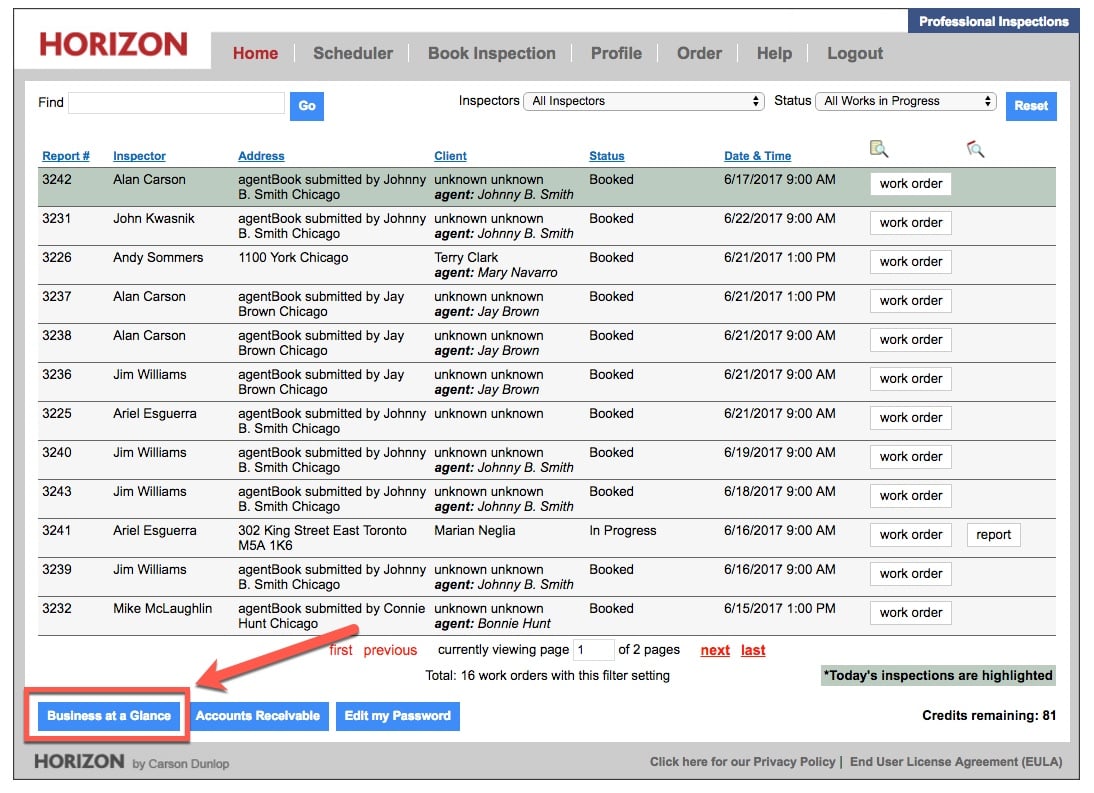
2) The Business at a Glance screen shows a set of bar graphs.
3) There are six graphs that you can include:
- Inspections by Month
- Sales by Type by Month
- Inspections by Type by Month
- Sales by Inspector by Month
- Inspections by Inspector by Month
- Sales by Month in a bar graph format.
4) The Business at a Glance screen also shows the following charts:
- Sales
- Sales by Inspector
- Inspections by Type
- Inspections by Inspector
- Fiscal Year Sales Comparison
- Fiscal Year Inspections Comparison
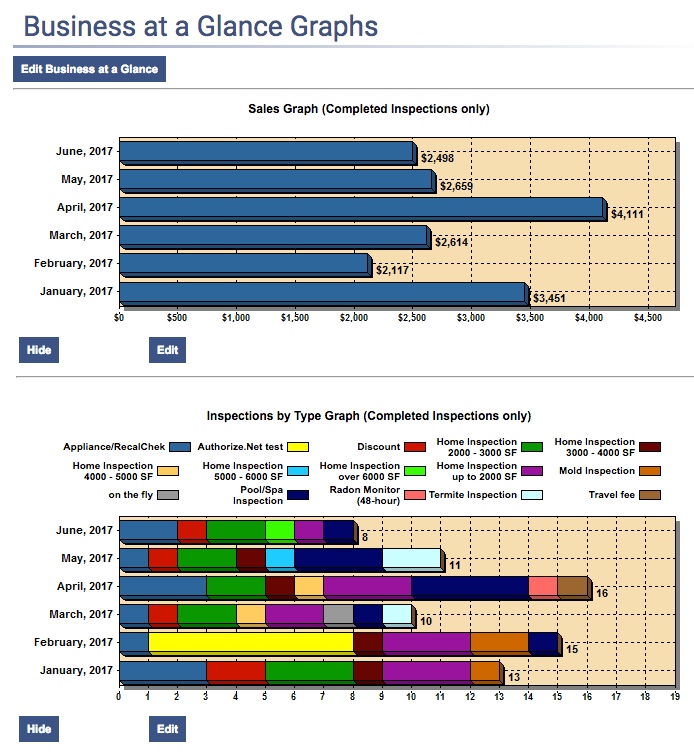
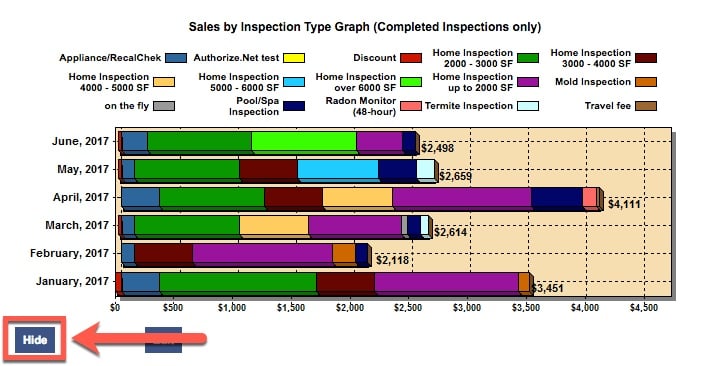
5) Each Business at a Glance report can be hidden. Click on Hide below the graph or chart to hide the selected report.
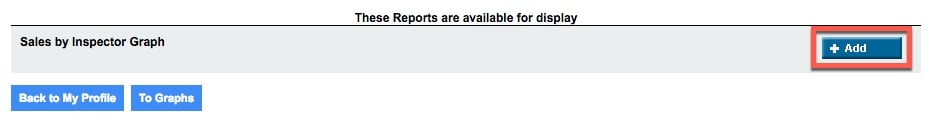
6) To show a hidden graph, click on Edit Business at a Glance from the top of the screen.
7) Click on Add.
8) Click on Back to My Profile.
Adding, removing and changing the order of reports
1) At the top or bottom of the screen, click on Edit Business at a Glance.
Note: You can also click Edit beside any graph or chart to edit or make changes. Or you can get there from Profile > Business reports.
2) Turn reports on with the + Add button and turn them off with the – Remove button.
3) Use Move to change the order in which reports appear.
4) Click the Move arrow in the direction you want the report to move in the list.
5) Click To Graphs once complete.
Changing the date range of reports
1) Click Edit beside any report.
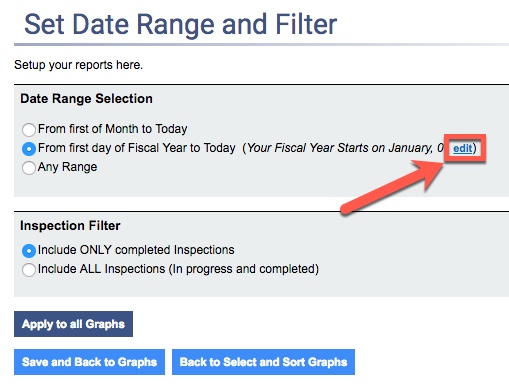
2) Look at Date Range Selection.
3) You have 3 choices.
a) From First of Month to Today displays month-to-date information.
b) From first day to Fiscal Year to Today displays year-to-date information.
c) The year starts on January 1 by default.
4) In this example, we will choose From first day of Fiscal Year to Today, followed by edit.
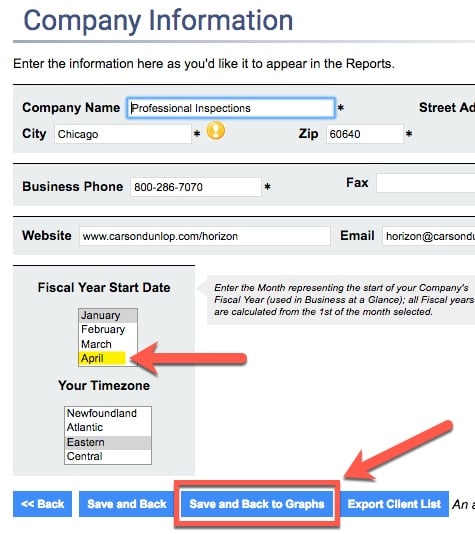
5) This takes you to the Company Information screen.
6) Under Fiscal Year Start Date, select the month.
7) Click Save and Back to Graphs.
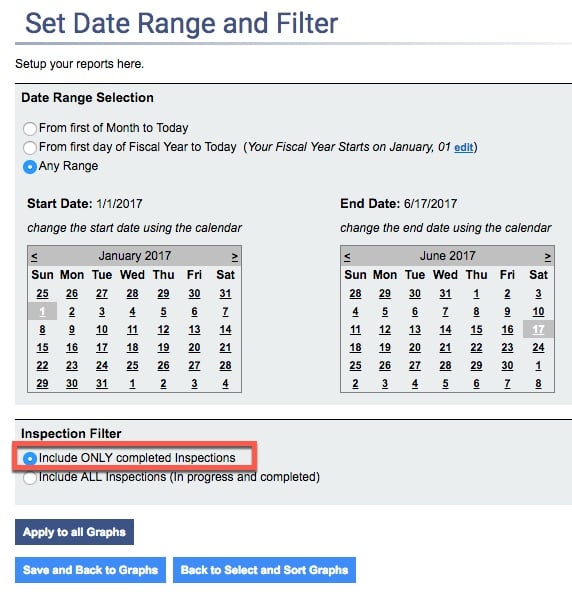
Including or excluding Works in Progress
1) You can click Include Only Completed Inspections in your reports, or include Inspections In Progress as well.
2) You can Apply to all Graphs if you like.
3) Click Save and Back to Graphs.
4) Click Back to Select and Sort Graphs to return to editing graphs without saving any changes.
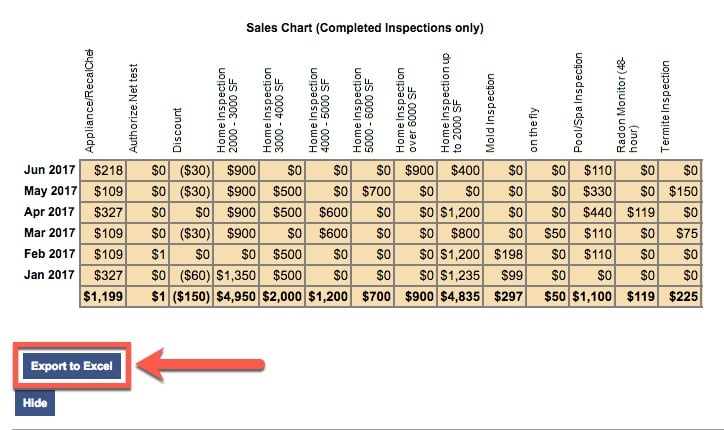
Exporting chart data to Excel
You can export the numbers from the charts (not the graphs) into Excel.
1) The charts are:
- Sales
- Sales by Inspector
- Inspections by Type
- Inspections by Inspector
- Fiscal Year Sales Comparison
- Fiscal Year Inspections Comparison
2) Select any one of the charts from Horizon. You need to have Microsoft Excel (the spreadsheet program) on your computer to view the exported file.
3) Click Export to Excel.
Note: You can manipulate this in Excel or import it into your accounting software. If you don’t work in Excel, you may need someone to help you with this. Giving the Excel file to a bookkeeper is often effective.